
The Pareto Principle claims that 80 percent of our results come from 20 percent of our efforts. This rule has been adopted my many fashion website to claim that:
We wear 20 percent of our clothes 80 percent of the time.
-many fashion websites and blogs
But could it be true? While I am sure we all have our favorite T-shirts and sweatpants, would we really wear the same 20 percent of our wardrobe 80 percent of the time?
I wanted to find out, so on June 15, 2019, I started tracking my clothes usage every day. It is now February 15, 2020, and I have eight months of data to share with you. Let’s find out how I did…
How Did I Track My Clothes for Eight Months?
While it may sound like a lot of work, it is pretty easy to track your clothes usage every day. The only time-consuming part was the setup, which went a little something like this:
- Find ALL of my clothes, shoes, and accessories
- Put them all on a table
- Itemize them into categories
- Input all of this information into an Excel spreadsheet
- Add formulas to the Excel spreadsheet to calculate the usage totals
- Put an “x” into the Excel spreadsheet for every item I wear each day
- Calculate the results at the end of each month
That’s pretty much it. I, of course, also take the added step of publishing my results on this website, but this set is optional.
If you are curious to know your own 80/20 wardrobe number, you could quickly set this up, too. In fact, to make it even quicker, you can download a FREE TEMPLATE of the same Excel spreadsheet I made and use for my experiment here:
If you need any help getting set up, I encourage you to reach out to me on the contact page of this website. I would be thrilled to support you in this fun, personal experiment.
I have written much more about the setup to this experiment on my very first update article Is the 80/20 Rule for Clothes Real (1-Month Self-Study). Give it a read if you would like to learn even more about this experiment.
The Original Numbers
When I began this experiment, I found out the following:
- I had 96 articles in my wardrobe
- 20% of 96 is 19.2 articles
- For simplicity sake, I rounded this to 19 items.
That was eight months ago, and things have changed in the last few months. For example, in MONTH 6:
- I found a pair of gloves I missed in the original itemization
- I added the gloves to my Excel spreadsheet
- This now meant I had 97 items in my wardrobe
- 20% of 97 articles is 19.4 items
- 19.4 becomes 19 items when rounded… NOTHING CHANGES! YAY!
Another Surprise… An Alpaca Hat from Yanantin Alpaca!
Then, in MONTH 7:
- I was gifted an amazing robe for my birthday… I love it, thank you!
- I added the robe to my Excel spreadsheet
- This now meant I had 98 items in my wardrobe
- 20% of 98 articles is 19.6 items
- 19.6 becomes 20 items when rounded… HOUSTON, WE HAVE A PROBLEM!
This is a bit of an issue, as it changes the consistency of the value of my 80/20 number from month to month. I did not like this.
So, to resolve the inconsistency I threw out an old pair of socks that I had worn 0 times during the experiment to make up for the added robe. This kept my itemized wardrobe at 97 articles, of which 20% remains 19 total items.

Problem solved… until MONTH 8:
- My girlfriend gifted me an (amazing!!!) alpaca woolen hat which she herself produced in her company Yanantin Alpaca. She also makes alpaca scarves and other alpaca products. While I do promote being frugal in your clothes spending habits, alpaca products are high quality, last forever, and are good for the environment… so should you consider buying something, you should totally check out Yanantin Alpaca!
- Back to me… This means I had 98 articles again, with the same issue as in month 7.
- So, I threw out a rain poncho that I had used 0 times during this experiment, and all is right with the consistency of my experiment once again… YAY!
I wanted to be transparent with you, and also to highlight how even the most frugal people like myself can still acquire clothes over time without seeking it out.
Now, imagine this happens to you birthday-after-birthday, Christmas-after-Christmas, year-after-year… it becomes possible to see how your closet will get filled with clothes without even buying it yourself!
What Are the Results After Eight Months?
So, how did my numbers look after 8 months? I have broken it down into some charts and graphs. Let’s see how I did:
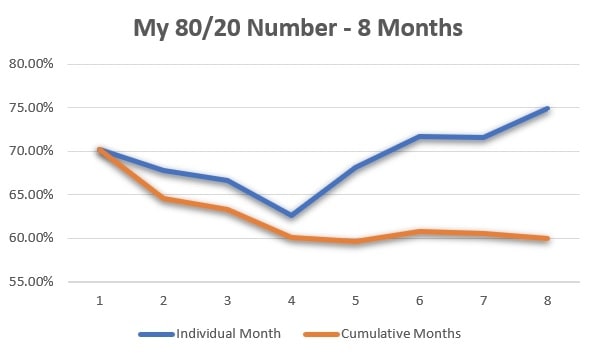
My 80/20 Rule Number for Each Individual Month:
| Month | 1 | 2 | 3 | 4 | 5 | 6 | 7 | 8 |
| Individual Month | 70.21% | 67.83% | 66.67% | 62.56% | 68.16% | 71.76% | 71.58% | 74.89% |
My 80/20 Rule Number for Each Cumulative Month:
| Month | 1 | 1-2 | 1-3 | 1-4 | 1-5 | 1-6 | 1-7 | 1-8 |
| Cumulative Months | 70.21% | 64.52% | 63.34% | 60.13% | 59.63% | 60.75% | 60.55% | 59.99% |
Graph of Above Data:

So, over the course of eight cumulative months, I wore 20% of my wardrobe 59.99% of the time!
That’s not 80/20, but it is still a pretty frequent amount of time to be wearing the same 19 articles of clothing. It does seem to show that we do, in fact, wear a small amount of our wardrobes a disproportionately frequent amount of time compared to our total wardrobe.
There are a few other things to note from the results so far:
- My cumulative 80/20 number has been a constant 60% during months 4, 5, 6, 7, and 8. Over the long term, things tend to average out, and it seems like my average will be that I wear 20 percent of my clothes about 60 percent of the time. There are still four more months to go, but the evidence is pointing in this direction.
- My monthly 80/20 number has fluctuated greatly, and reached a high of 74.89%! In the short term, things get a little wilder and more unpredictable. This last month was cold, so I wore the same cold-weather clothes over and over again. I am guessing that as the weather begins to get warmer that this number will decrease drastically again as I will have more options of what to wear on a daily basis.
The Percent of My Total Wardrobe Worn for Each Individual Month:
| Month | 1 | 2 | 3 | 4 | 5 | 6 | 7 | 8 |
| Individual Month | 53.61% | 54.64% | 56.70% | 68.04% | 60.82% | 65.98% | 74.23% | 64.95% |
The Percent of My Total Wardrobe Worn for Each Cumulative Month:
| Month | 1 | 1-2 | 1-3 | 1-4 | 1-5 | 1-6 | 1-7 | 1-8 |
| Cumulative Months | 53.61% | 61.86% | 71.13% | 77.32% | 80.41% | 84.54% | 87.64% | 88.66% |
Graph of Above Data:
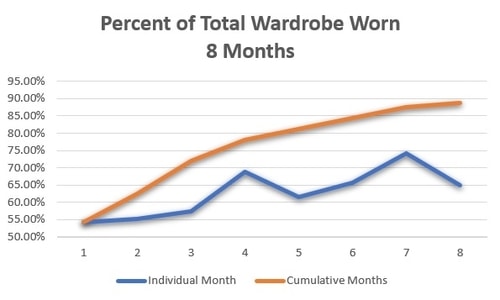
After eight months, I have used 88.66% of my entire wardrobe!
The march to 100% continues. It is nice to see that I have worn the vast majority of my clothes over the last eight months. It let’s me know that I have just about the right amount of clothes for my needs, and that I am OK with what I have.
The remaining unused items are basically dress pants and shoes, as well as specialty sports-wear like a water-resistant shirt and hiking pants. I would expect to use these again in the future, so I will keep them for those rarer moments when they are needed.
Otherwise, for my everyday needs, I have what I need and I use it all. That’s super!
What Does My 80/20 Number Mean?
Quite literally, it means that I personally wear 20 percent of my clothes about 60 percent of the time over an eight-month period.
It also means that over a shorter period of one month, I regularly wear 20 percent of my clothes over 70 percent of the time. I did this 4 out of 8 months, or 50% of the time. This gives a little credence to the claim that we wear 20 percent of our clothes 80 percent of the time… at least in the short term.
It also shows that even the most frugal of people, such as myself, will acquire clothes over time. Clothes do make nice gifts, and they are deeply appreciated by the person who receives them. Still, it can lead to over-stuffed wardrobes filled with unused and unloved clothes, clothes that could be used by someone else.
It also means that we all probably have the clothes that we need in our wardrobes already. Instead of buying more for yourself, or buying clothes as gifts for someone else, you could invest that money in other things, like:
- Books
- Trips
- Experiences
- Other needed items for around the house
- Anything but more clothes…
My Fat, Broke and Stupid YouTube Video
Did you know that I also have my Fat, Broke and Stupid YouTube Channel? Click the link and hear me talk about this challenge, or click the video below and watch it here:
Remember to subscribe and hit the notification bell to be the first to see all of my update videos moving forward on this, and all of my other, experiments and challenges!
Do You Want to Know You 80/20 Wardrobe Number?
If you would like to try this out for yourself, download my 80/20 wardrobe Excel spreadsheet here and give it a go.
Again, if you need help getting set up, please reach out to me on my contact page.